


What is Anchored VWAP i.e AVWAP?
Anchored VWAP (Volume Weighted Average Price) is a powerful technical indicator that calculates the average price of a security from a specific starting point, weighted by volume. Unlike regular VWAP that resets daily, anchored VWAP lets you choose any point in time as your anchor - whether it's a significant high, low, earnings announcement, or major news event.
The beauty of anchored VWAP lies in its ability to show you the "fair value" of a stock from any meaningful point. It acts as dynamic support and resistance, helping traders understand where institutional money might be positioned and where price reactions are likely to occur.
Why Traders Love Anchored VWAP
Anchored VWAP is incredibly useful because it gives you context about price action from important levels. When a stock bounces off anchored VWAP, it often signals that the level is acting as support or resistance. Many institutional traders use VWAP-based strategies, so these levels tend to be self-fulfilling prophecies.
The indicator also helps you understand whether you're buying at a discount or premium relative to the average price since your chosen anchor point. If price is above the anchored VWAP, buyers have been in control since that anchor. If it's below, sellers have had the upper hand.
Free Tool for Easy AVWAP Analysis
If you're looking for an easy-to-use anchored VWAP tool that won't cost you anything, you can check out our research tab at Rallies. It makes setting up and analyzing anchored VWAP levels straightforward, even if you're new to using this indicator. Simple click on the AVWAP indicator in the screenshot below and select any candle you want to anchor from.

Setting Up Your Anchored VWAP
The first step is identifying notable anchor points on your chart. These could be:
- Significant highs or lows
- Breakout points
- Earnings announcements
- Major news events
- Gap openings
Once you've spotted your anchor point, you simply click on that candle to create your anchored VWAP line. The indicator will then calculate the volume-weighted average price from that point forward.
Real-World Example 1: Google (GOOGL) - Anchoring from Lows
Let's look at how anchored VWAP works in practice with Google's stock chart. We'll start by anchoring VWAP from notable lows to see how these levels can act as support.

In this Google example, you can see how we've anchored VWAP from a significant low point. Notice how the price respects this level multiple times, bouncing off it as support. This happens because the anchored VWAP represents the average price that volume has traded since that low point.
When price approaches the anchored VWAP from above and finds support, it suggests that buyers are willing to step in at this "fair value" level. The multiple bounces show that this level has become psychologically important for traders.
The key here is that we're not just drawing random lines - we're using actual volume-weighted data to identify where meaningful price reactions might occur.
Real-World Example 2: AMD - Multiple Anchor Points
Now let's examine AMD to see how anchored VWAP works from both tops and bottoms, demonstrating its versatility as both support and resistance.
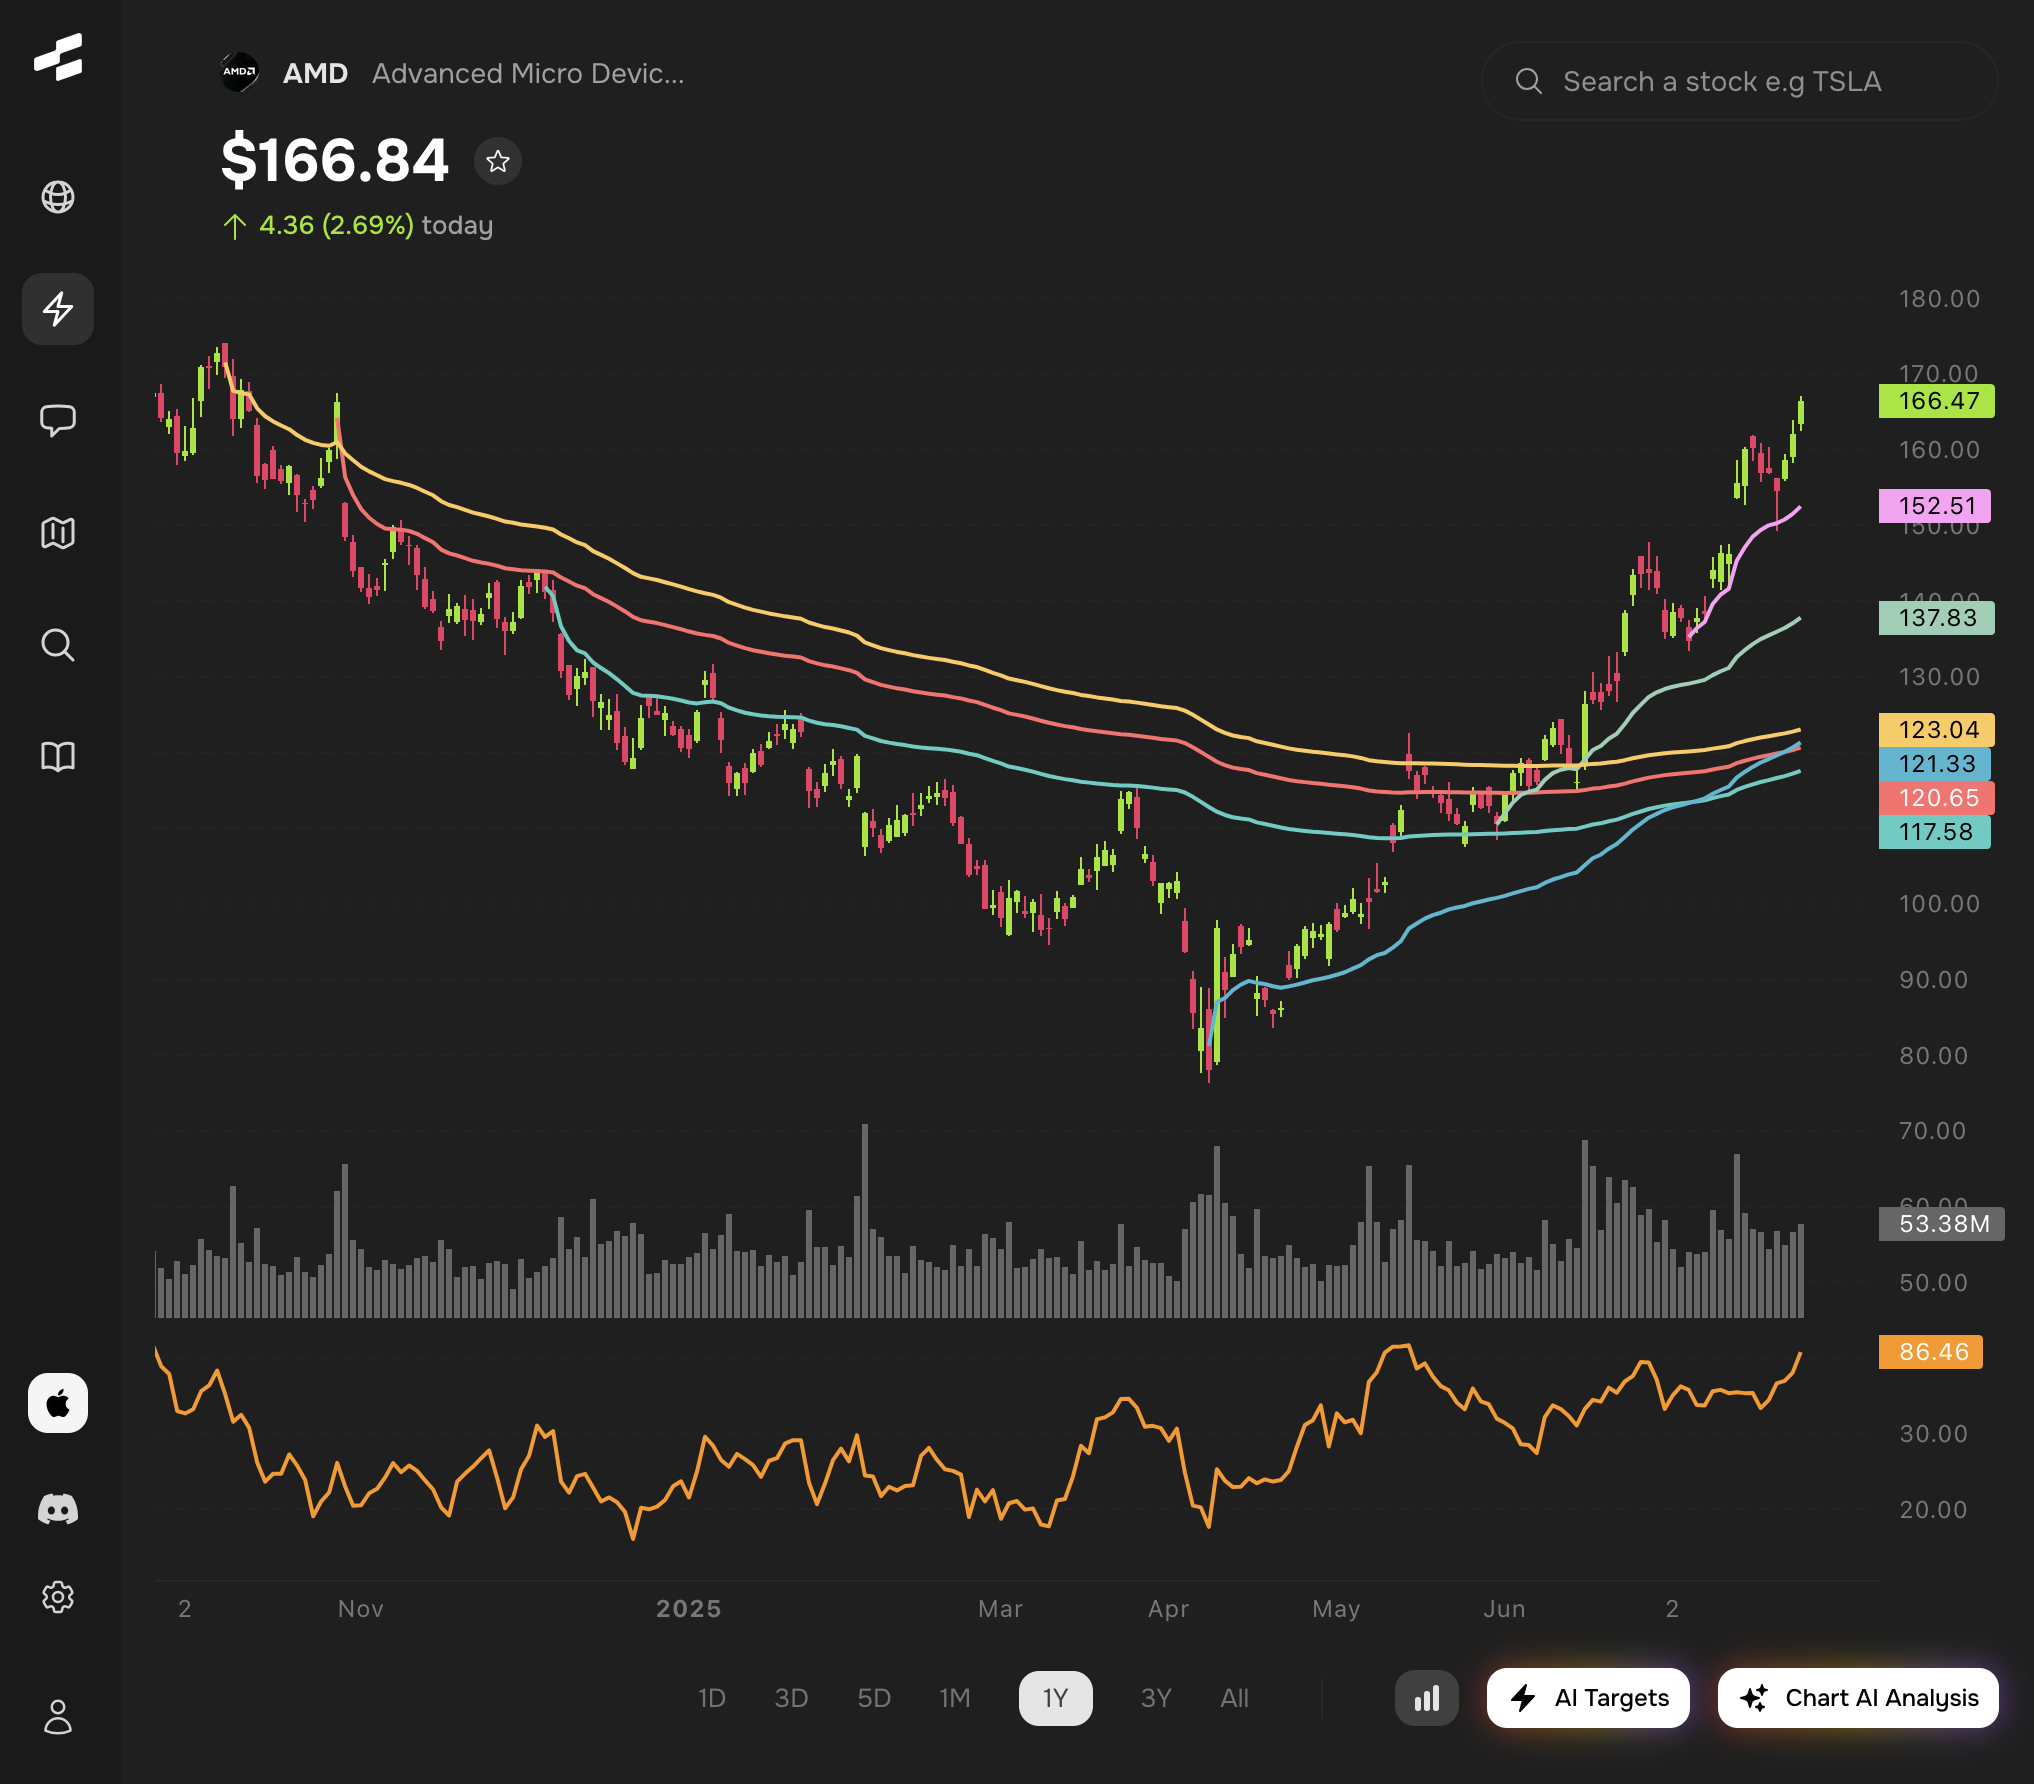
With AMD, we can see a more complex scenario. We've anchored VWAP from both a significant high and a major low. This gives us two important reference levels:
The anchored VWAP from the high (shown in one color) acts as resistance when price approaches from below. You can see how AMD struggled to break above this level multiple times before finally pushing through.
The anchored VWAP from the low (in a different color) serves as support during pullbacks. Notice how price finds buyers near this level, creating bounce opportunities for traders.
This dual-anchor approach is particularly powerful because it gives you both upside and downside reference points. When price is between these two anchored VWAP levels, you're in a defined range with clear support and resistance zones.
Key Takeaways for Using Anchored VWAP
The most important thing to remember is that anchored VWAP works best when you anchor from truly significant points. Don't anchor from every small swing - focus on the moves that really matter.
Watch for multiple touches of your anchored VWAP levels. The more times price respects a level, the more significant it becomes. When you see three or four bounces off the same anchored VWAP, that's a strong signal the level is working.
Also pay attention to how price breaks through anchored VWAP levels. A strong break with volume often signals that the trend is shifting, while weak breaks that quickly reverse suggest the level is still holding.
Remember, anchored VWAP is just one tool in your trading toolkit. It works best when combined with other forms of analysis like support and resistance, trend lines, and volume patterns. The goal is to build a complete picture of what's happening in the stock, not to rely on any single indicator.
Start simple with one or two anchor points, get comfortable with how the indicator behaves, and then gradually add more complexity to your analysis. With practice, anchored VWAP can become one of your most reliable tools for identifying high-probability trading opportunities.


