


Sector Rotations
Sector rotation happens when money flows from one sector of the market to another. Think of it as institutional investors and smart money shifting their bets based on economic cycles, interest rate changes, or market sentiment shifts.
These rotations aren't random - they follow patterns based on what's happening in the economy. When growth is strong, you might see money flow into technology and consumer discretionary stocks. When uncertainty rises, investors often rotate into defensive sectors like utilities and consumer staples.
Why Finding Sector Rotations Matters
Understanding sector rotations is crucial because it tells you where the smart money is moving. Instead of fighting the current, you can swim with it by focusing on sectors that are attracting capital.
When you spot a rotation early, you can position yourself in the leading sectors before the move becomes obvious to everyone else. This gives you a significant edge because you're riding the wave of institutional money flows rather than trying to pick individual stocks in declining sectors.
Sector rotations also help you avoid value traps. A stock might look cheap, but if its entire sector is being abandoned by institutions, that "bargain" could keep falling for months.
Building Sector Rotation Charts
The easiest way to spot sector rotations is by plotting sector ETFs on the same chart and comparing their performance over time. This gives you a clear visual of which sectors are leading and which are lagging. Here is an example from Rallies.
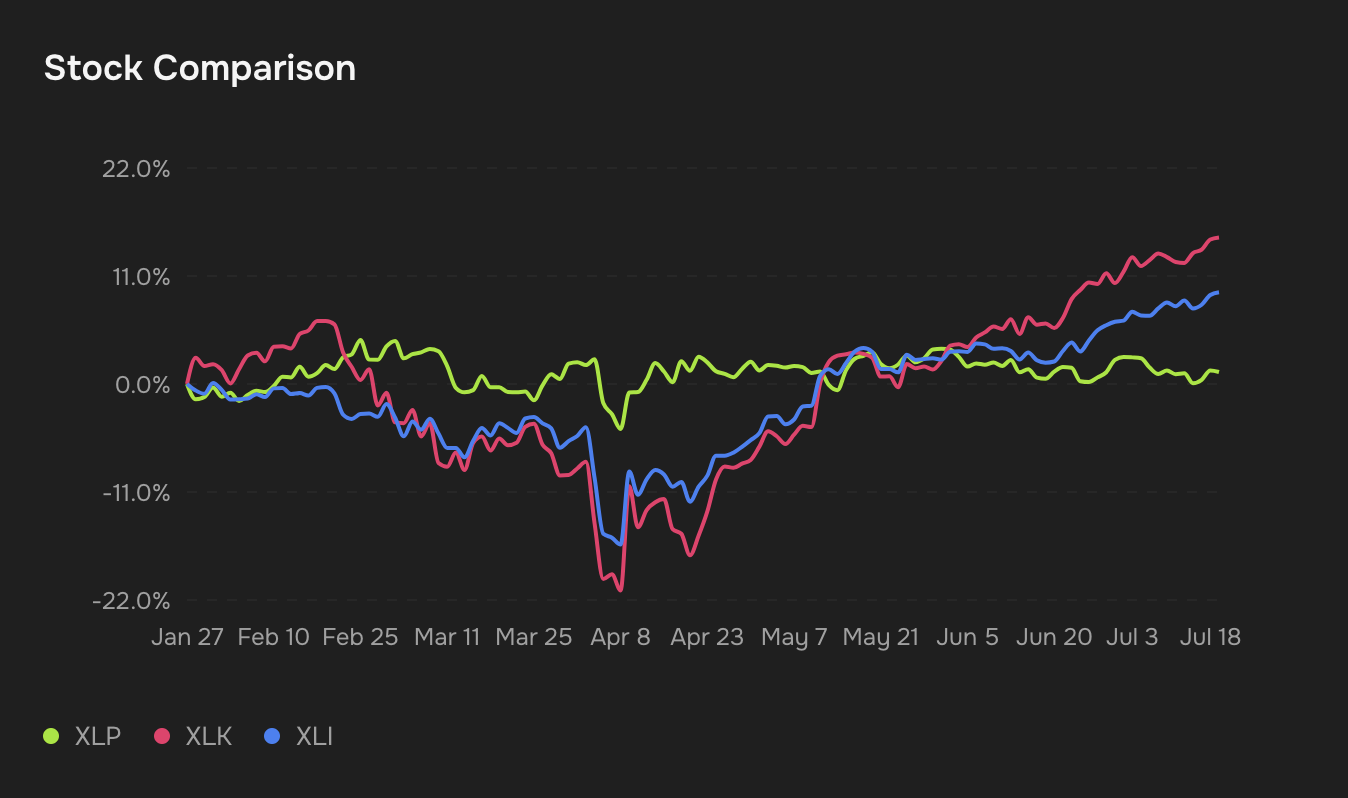
In this simplified comparison chart, we can see three major sectors plotted together: Consumer Defensive (XLP), Technology (XLK), and Industrials (XLI). The chart makes it immediately obvious which sectors have been outperforming since the beginning of the year.
Notice how all three sectors moved together during the March selloff, but then diverged significantly in their recovery. Technology (shown in red) has clearly been the standout performer, while Consumer Defensive (green) has remained relatively flat, and Industrials (blue) has shown steady but moderate gains.
This type of visualization makes sector rotation patterns jump out immediately. You can see when money started flowing into technology around late April and how that trend has accelerated through the summer months.
Current Sector Rotation Analysis
Based on recent performance data, we're seeing clear evidence of rotation favoring growth-oriented sectors over defensive plays. Here's what the numbers tell us:
Technology (XLK) is the clear winner with gains of 12.67% year-to-date. The sector has been on a tear since late April, significantly outpacing other areas of the market. This suggests investors are betting on continued growth and innovation.
Industrials (XLI) comes in second with solid 17.63% year-to-date returns. This sector has moved closely with technology after the April dip, showing steady gains that reflect optimism about economic activity and infrastructure spending.
Consumer Defensive (XLP) has been the laggard with only 3.68% gains year-to-date. This makes sense in a growth-focused environment where investors are willing to take on more risk for higher returns.
Reading the Full Sector Landscape
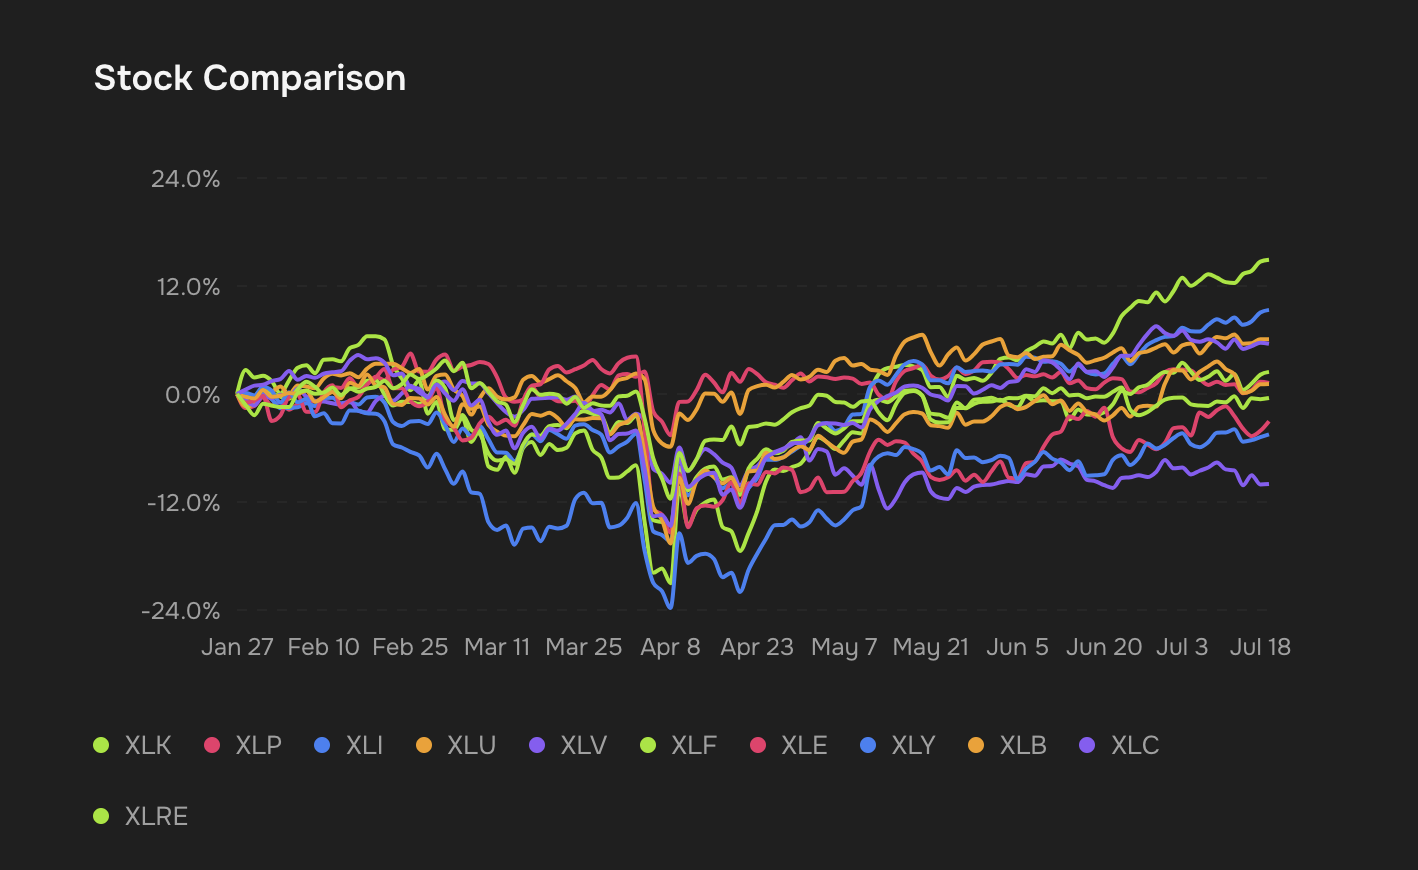
When we expand our view to include all major sectors, the rotation story becomes even clearer. This comprehensive chart shows how different sectors have performed relative to each other throughout the year.
You can see that beyond the top three performers, there's been significant dispersion in sector performance. Some sectors that started strong in early 2024 have given back their gains, while others have steadily climbed higher.
The chart also reveals the timing of major rotation events. Notice how most sectors bottomed around the same time in March, but their recovery trajectories have been vastly different. This divergence is the essence of sector rotation - money leaving some areas and concentrating in others.
Identifying Rotation Triggers
Sector rotations often coincide with major economic events or shifts in market sentiment. Interest rate changes, earnings seasons, geopolitical events, and economic data releases can all trigger money to move between sectors.
The current rotation into technology and industrials suggests investors are positioning for continued economic growth and technological advancement. Meanwhile, the relative weakness in defensive sectors indicates reduced fear about economic downturns.
Pay attention to these catalysts because they often signal the beginning of new rotation cycles. When you see a major policy announcement or economic shift, start watching for which sectors begin to attract or lose capital.
Using Sector Rotation in Your Strategy
Once you've identified which sectors are leading, you can use this information in several ways. The most direct approach is investing in the leading sector ETFs themselves, riding the momentum of institutional flows.
You can also use sector analysis to guide individual stock picks. Focus your research on companies within the leading sectors, as they're more likely to benefit from the tailwinds of institutional buying.
Conversely, be cautious about investing in lagging sectors unless you have a very specific catalyst-driven thesis. Even great companies can struggle when their entire sector is out of favor.
Tools for Tracking Rotations
While you can build these charts manually, using a platform like Rallies where you can just ask for these charts through natural language saves time and ensures you don't miss important rotations. The ability to quickly plot multiple sector ETFs and analyze their relative performance is essential for staying on top of market flows.
Look for tools that let you easily adjust timeframes, add or remove sectors, and overlay additional indicators. The faster you can spot emerging rotations, the better positioned you'll be to capitalize on them.
Key Takeaways
Sector rotation is one of the most reliable patterns in markets because it reflects real money flows from institutional investors. By tracking which sectors are attracting capital, you can align your investments with the dominant market forces.
Start by monitoring the major sector ETFs and looking for clear divergences in performance. When you see sustained outperformance in certain sectors, that's your signal that a rotation is underway.
Remember that rotations can last for months or even years, so don't expect immediate reversals. Once a rotation begins, it often continues longer than most people expect, creating extended opportunities for those who recognize the trend early.
Stay focused on the leaders and be willing to shift your focus as new rotations emerge. The market is constantly evolving, and the sectors leading today may not be the leaders tomorrow.


