


What is RSI Divergence?
RSI divergence occurs when the price of a stock moves in the opposite direction of the RSI indicator. While the price might be making new highs, the RSI could be making lower highs, or vice versa. This disconnect between price action and momentum often signals that the current trend is losing steam.
There are two main types of divergence: bullish and bearish. Bullish divergence happens when price makes lower lows while RSI makes higher lows, suggesting selling pressure is weakening. Bearish divergence occurs when price makes higher highs while RSI makes lower highs, indicating buying momentum is fading.
Why Divergences Matter for Traders
Divergences are powerful because they reveal what's happening beneath the surface of price action. While a stock might appear to be trending strongly in one direction, the RSI can show that the underlying momentum is actually weakening.
This early warning system gives traders a chance to position themselves before major reversals occur. Instead of chasing trends that are about to end, divergence analysis helps you spot potential turning points while most other traders are still caught up in the previous move.
The key insight is that price often moves first on emotion and news, while indicators like RSI reflect the underlying technical health of the move. When these two start disagreeing, it's usually the indicator that's giving you the more reliable signal about what comes next.
Real-World Example: SPY's Bullish Divergence Signal
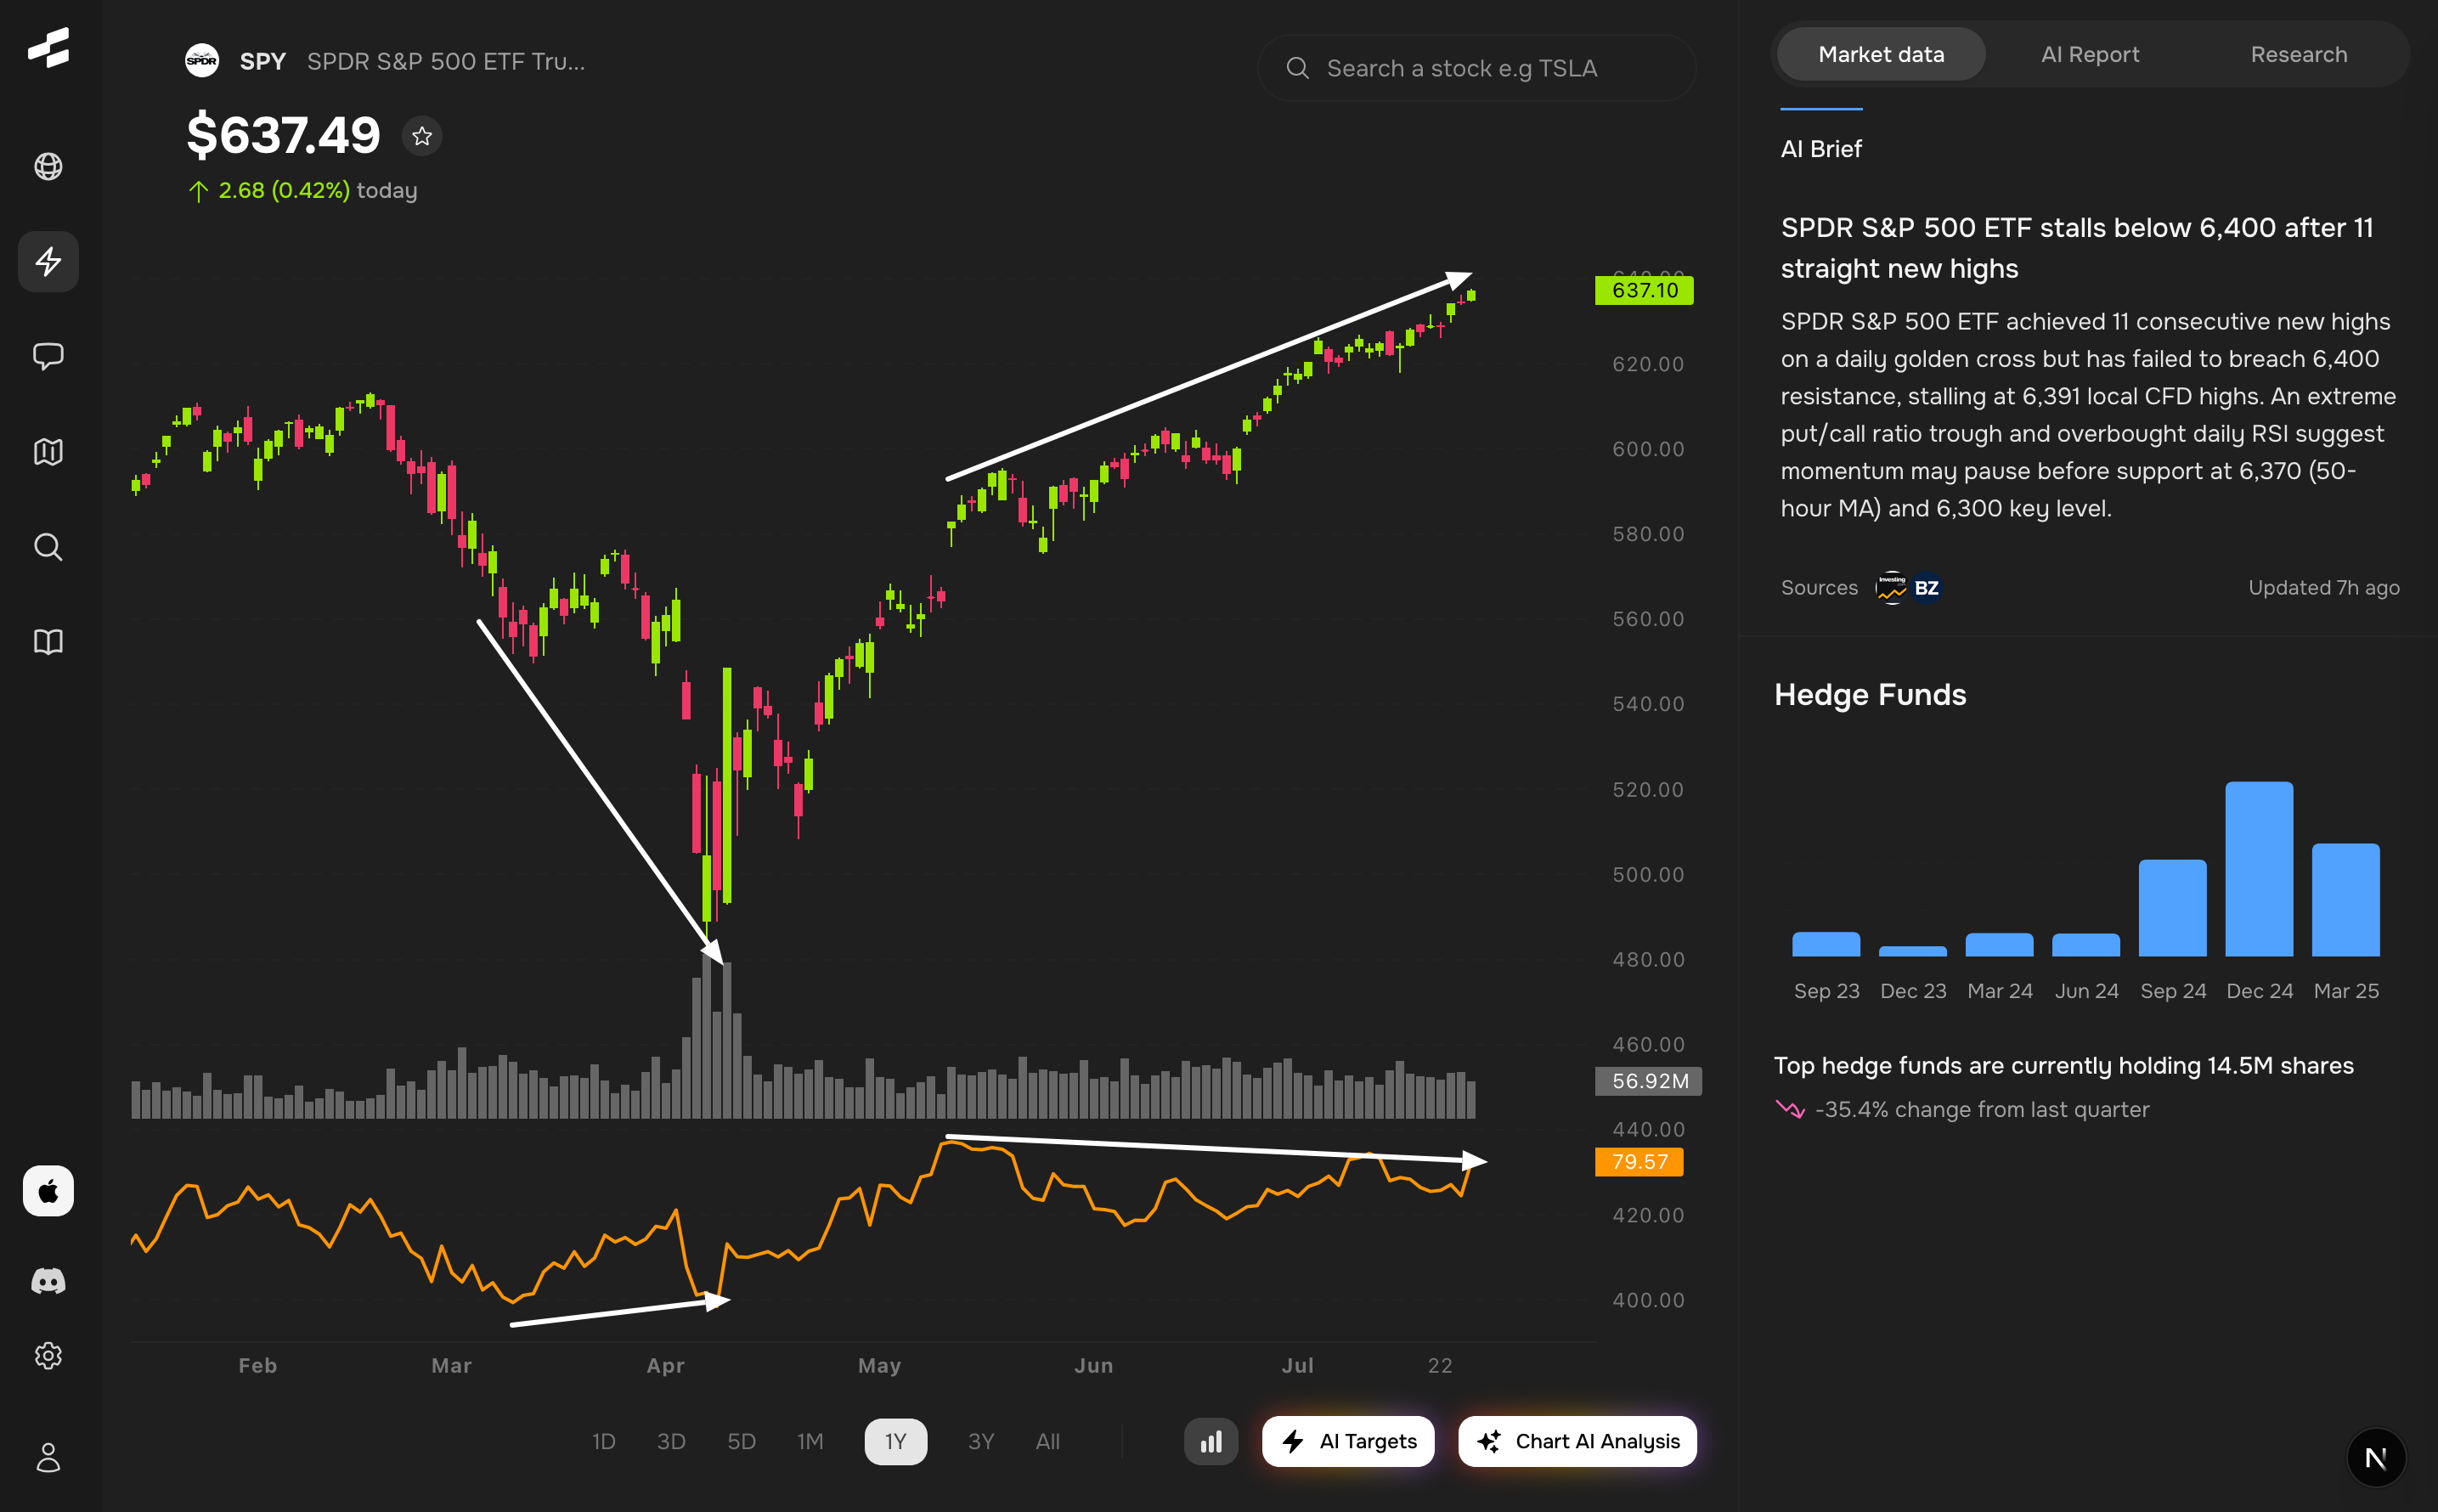
Let's examine a perfect example of how RSI divergence works in practice using the SPY chart. Looking at the March timeframe, you can see a classic bullish divergence pattern that marked an important bottom.
During this period, SPY's price made clear lower lows, dropping to around the 500 level. However, if you look at the RSI indicator at the bottom of the chart, it was actually making higher lows during the same timeframe. This created a clear bullish divergence signal.
The white arrows on the chart highlight this divergence perfectly. While price was selling off and making new lows, the RSI was showing that selling momentum was actually weakening. This was a strong early signal that the downtrend was running out of steam.
Sure enough, this bullish divergence marked what turned out to be a significant bottom for SPY. The subsequent rally took the index from around 500 to over 630 - a massive move that divergence traders were positioned for early.
Current Bearish Divergence Setup
What makes this example even more interesting is what's happening now on the same SPY chart. As the index has been making new highs above 630, notice what the RSI has been doing - it's been making lower highs.
This creates a bearish divergence pattern, the mirror image of what we saw at the March bottom. While SPY continues to grind higher and make new highs, the RSI is showing that buying momentum is actually weakening with each push higher.
This doesn't guarantee an immediate reversal, but it's a warning sign that the current uptrend may be losing steam. Traders who understand divergence patterns are now watching for other confirmation signals that could indicate a potential top is forming.
The beauty of divergence analysis is that it gives you this early warning before the reversal becomes obvious to everyone else. By the time price starts falling sharply, the divergence traders have already been positioned for the move.
Finding Divergences with Rallies
While you can spot divergences manually by comparing price action to RSI, it's much easier when you have tools that can scan for these patterns automatically. The traditional approach requires constantly monitoring charts and drawing trend lines on both price and RSI.
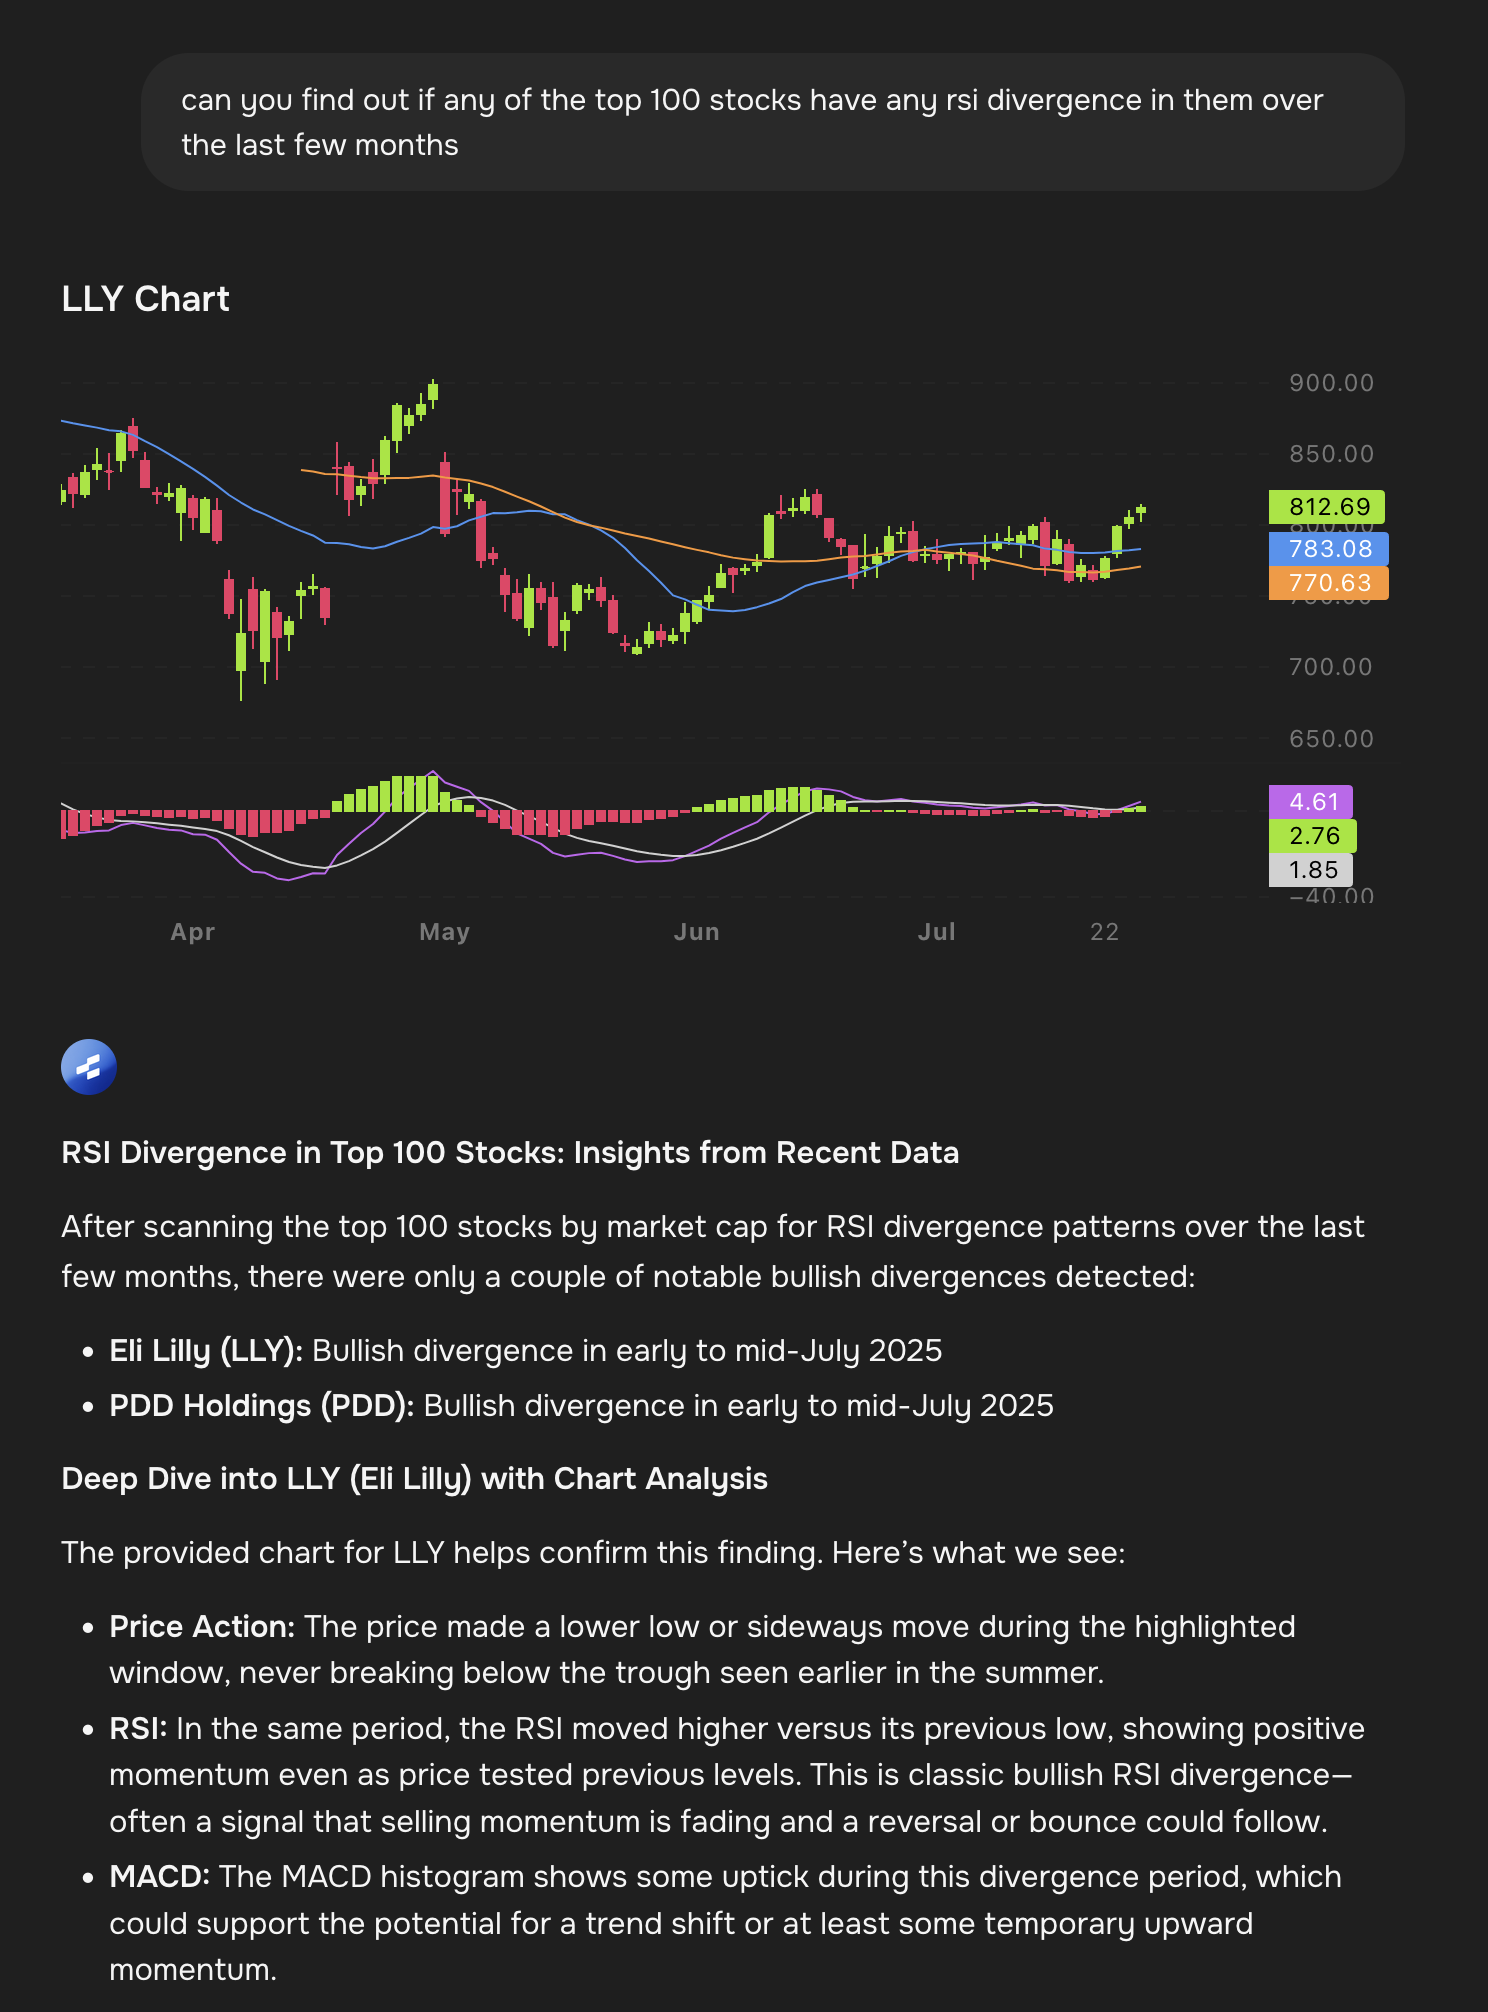
Rallies can scan hundreds of stocks for divergence patterns in seconds. As shown in this analysis of top 100 stocks, only a couple of notable bullish divergences were detected in recent months - Eli Lilly (LLY) and PDD Holdings (PDD) both showing bullish divergence patterns in early to mid-July.
The LLY chart demonstrates a textbook example. During the highlighted period, the price made lower lows or moved sideways, never breaking below previous support levels. Meanwhile, the RSI moved higher compared to its previous low, showing positive momentum even as price tested previous levels.
This type of analysis would take hours to do manually across 100 stocks, but automated scanning makes it possible to identify these opportunities quickly and efficiently.
Trading Divergence Signals
When you spot a divergence, it's important to remember that it's a warning signal, not an immediate trade trigger. Divergences can persist for weeks or even months before the actual reversal occurs, so timing your entry is crucial.
The best approach is to use divergence as a filter for other trading setups. When you see bearish divergence, you might avoid buying calls or consider taking profits on long positions. When you spot bullish divergence, you could start watching for oversold bounces or reversal patterns.
Volume often plays a key role in confirming divergence signals. If you see bullish divergence accompanied by declining volume on the selloff, it suggests that selling pressure is indeed weakening, making the divergence signal more reliable.
Key Takeaways for Divergence Trading
RSI divergence is one of the most reliable early warning systems for potential trend reversals. By comparing price action to momentum, you can spot when trends are losing steam before it becomes obvious to other traders.
The most powerful divergences occur at significant support and resistance levels where the market is already likely to react. When divergence aligns with these key levels, the probability of a reversal increases substantially.
Remember that divergence signals work best when combined with other forms of analysis. Use them as a piece of the puzzle rather than a standalone trading strategy, and always wait for confirmation before taking action.
Whether you're scanning manually or using automated tools, incorporating divergence analysis into your trading routine can significantly improve your ability to spot high-probability reversal opportunities before the crowd catches on.


