


Understanding Gamma: The Foundation
Before we dive into gamma walls, let's understand what gamma actually is. Gamma measures how much an option's delta changes when the underlying stock price moves by $1. Think of it as the "acceleration" of an option's price sensitivity.
When you buy a call option, you have positive gamma. When market makers sell you that call, they take on negative gamma. This creates an interesting dynamic - as the stock price moves toward your strike price, market makers need to buy more shares to stay hedged. As it moves away, they sell shares.
What Are Gamma Walls?
Gamma walls are price levels where there's a massive concentration of options gamma exposure (GEX). These levels act like magnets for stock prices because of how market makers need to hedge their positions.
Here's how it works: When there's huge gamma exposure at a specific strike price, market makers have to do a lot of buying or selling to stay properly hedged as the stock approaches that level. This creates natural support or resistance zones that can be incredibly powerful.
The wall effect happens because the closer a stock gets to a high-gamma strike, the more aggressively market makers need to hedge. This hedging activity can either push the stock toward the strike (if dealers are short gamma) or away from it (if they're long gamma).
How Gamma Walls Influence Price Action
Gamma walls work differently depending on whether dealers are net long or short gamma at a particular strike. When dealers are short gamma at a strike (meaning retail traders are long), they create a feedback loop that pulls prices toward that level.
As the stock approaches a gamma wall from below, dealers who are short calls need to buy shares to hedge. This buying pressure helps push the stock higher toward the wall. Conversely, if the stock drops away from the wall, dealers sell shares, adding to the downward pressure.
This creates what traders call "pinning action" - where stocks tend to gravitate toward and get stuck near high-gamma strikes, especially around expiration when gamma effects are strongest.
Detecting Gamma Walls Manually
If you have access to options data, you can identify gamma walls by looking for strikes with unusually high gamma exposure. You'll want to focus on near-term expiration dates since gamma effects are most pronounced close to expiry.
Start by calculating the total gamma exposure at each strike price. Look for strikes where the gamma exposure is significantly higher than surrounding levels - these are your potential walls. Pay special attention to round numbers like $500, $550, $600, since these tend to attract more options activity.
You'll also want to consider the net positioning. Are dealers long or short gamma at these levels? This tells you whether the wall will act as a magnet (short dealer gamma) or a repelling force (long dealer gamma).
Volume and open interest matter too. A strike might have high gamma, but if there's no real money behind it, the wall effect will be weak. Look for strikes with both high gamma and substantial open interest.
Finding Gamma Walls the Easy Way
While manual analysis works, it's time-consuming and requires specialized data feeds. If you're looking for a simpler approach, you can easily find current gamma walls by just asking about them in our chat.
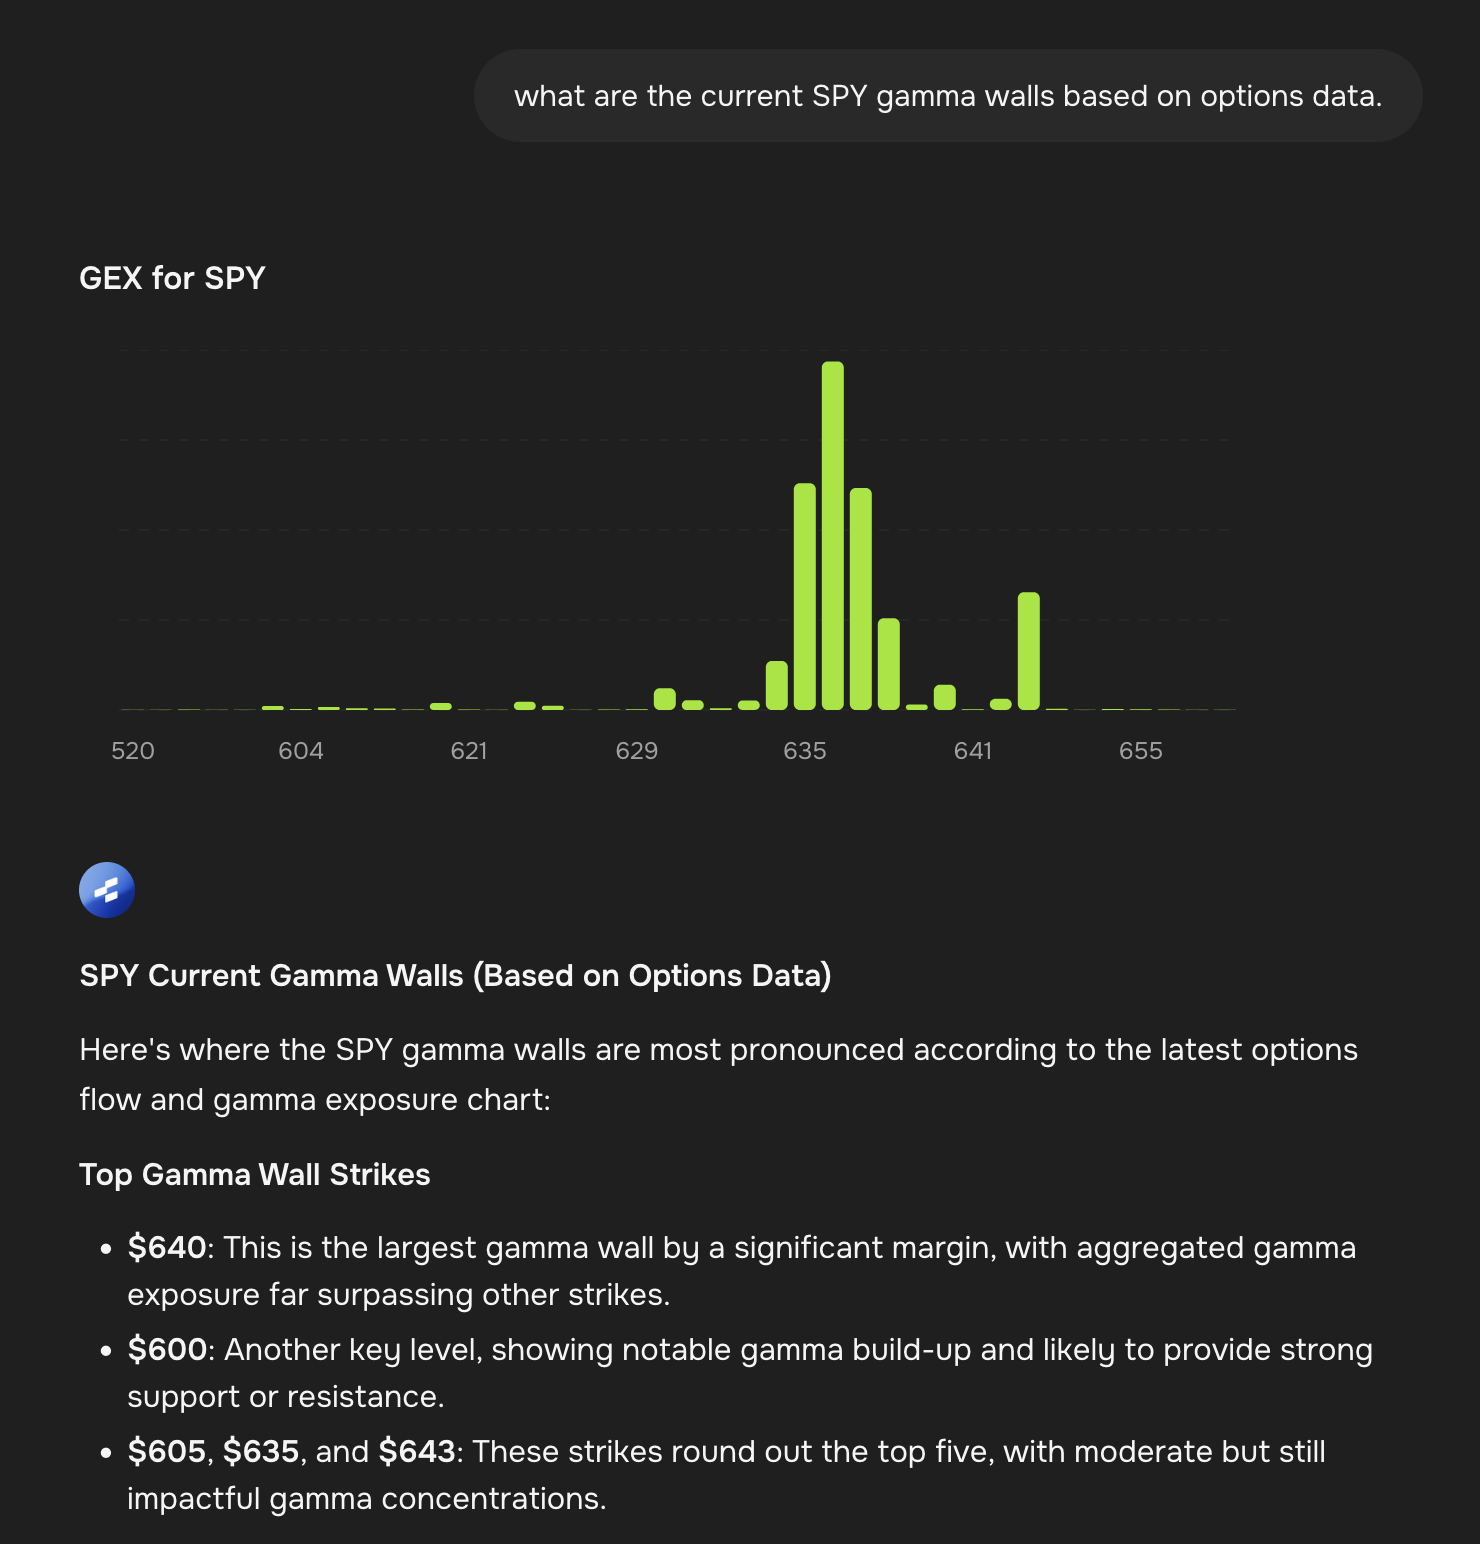
As you can see in this SPY gamma exposure chart, the data shows exactly where the most significant gamma walls are located. The chart makes it immediately clear which strikes have the highest concentration of gamma exposure.
Current SPY Gamma Wall Analysis
Based on the latest options data as shown in the screenshot above, here are the most significant gamma walls for SPY:
$640 - The Monster Wall: This level shows massive gamma exposure that dwarfs other strikes. When you see this kind of concentration, it often becomes a major magnet for price action. The sheer size of this wall suggests it could provide very strong support or resistance depending on how dealers are positioned.
$600 - Secondary Support: This round number shows notable gamma buildup and is likely to act as a significant level. Round numbers like this tend to attract retail options activity, which amplifies the gamma wall effect.
$605, $635, and $643: These strikes complete the top five gamma walls. While smaller than the main walls, they still represent meaningful levels where price reactions are more likely to occur.
Trading Around Gamma Walls
Understanding gamma walls can significantly improve your trading decisions. When you see price approaching a major gamma wall, expect increased volatility and potential pinning action around that level.
If price is trending toward a gamma wall, don't be surprised if it gets "stuck" there, especially on expiration days. This pinning effect can create excellent opportunities for range-bound strategies or help you time entries and exits more effectively.
Remember that gamma walls are most powerful near expiration when time decay accelerates gamma effects. As expiration approaches, these walls become stronger magnets for price action.
Key Takeaways
Gamma walls represent some of the most reliable technical levels in modern markets because they're based on real money flows from market maker hedging activity. Unlike traditional technical analysis that relies on historical price patterns, gamma walls show you where institutional hedging pressure will occur in real-time.
The key is identifying strikes with massive gamma exposure and understanding whether dealers are positioned long or short at those levels. This tells you whether the wall will attract or repel price action.
Start by focusing on the biggest walls - these typically have the most significant impact on price movement. As you get more comfortable with the concept, you can begin incorporating smaller gamma levels into your analysis for more nuanced trading decisions.


